
The Incredible Shrinking Solar Array: A Red Flag Warning for Solar Shoppers
June 30, 2026
4 min read
[Originally published on February 10, 2022, | Updated on January 24, 2024 - 5 min read]
So, your solar energy system is installed and commissioned. You're making your green energy while saving some green, too. Yay! Now what?
This is where your monitoring and solar service provider comes into play. Solar monitoring is one of the most important aspects of the long-term maintenance of your solar array. With proper monitoring, you'll be able to detect if your system isn't performing at peak performance and will be able to contact your solar service provider quickly to minimize downtime.
In this blog, we review the basics of the SolarEdge app so you can actively monitor your solar energy system. If you've ever wondered what the colored lights mean or how to turn your system on and off, we've got you covered. So, read on and learn all about solar monitoring, and if you have any additional questions, please feel free to contact us here.
To get started, you can download the SolarEdge app from the App Store or the Google Play Store. When you first log into your app, there are different sections on your main dashboard. These are your site overview, power flow diagrams, power and energy, and comparative energy sections.
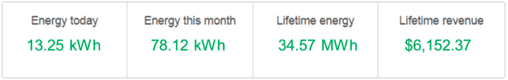
This is cumulative data about your system. If you have multiple systems, you'll see multiple sites listed here, but most of the time, homeowners will have a singular system.
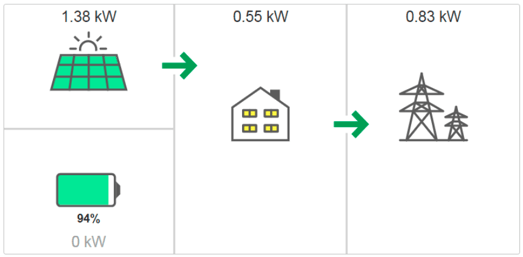
This section illustrates the real-time workings of your solar array. It shows how much energy you're pulling from the grid and how much energy your system produces.
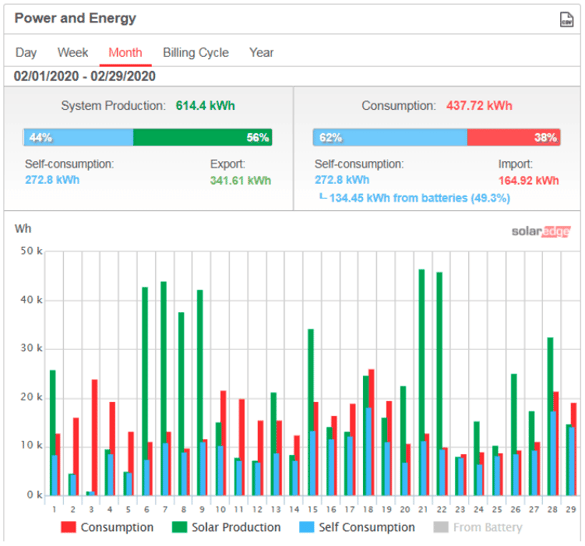
This section breaks down how much you're producing and using from your solar array and how much you're importing from the grid. The System Production bar on the left shows your solar array's production. This covers how much solar energy was used to power site loads and how much solar energy was exported to the grid.
The Consumption bar on the right-hand side shows the energy consumed from solar energy and the amount of energy imported from the grid.
The graph below these two bars gives a color-coded visual of the data, with time being on the X-axis and power produced in kW on the Y-axis.
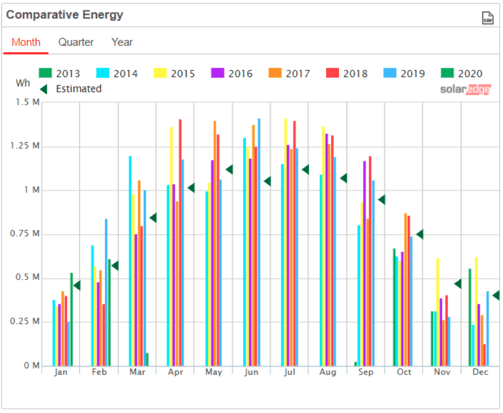
If you've had your system for over a year, you can compare year-over-year data in this section. You can even select specific periods to compare.
The lights on your inverter can help you determine its status. Below are the different colors your inverter might show and what they mean.
 Blue light: Your inverter is communicating with your monitoring system.
 Greenlight: Your system is producing and operating normally.
 Flashing green light: Your system is connected to the grid but is not producing energy.
 Red light: This means a system error with your solar array. We recommend power cycling your inverter (see the next section below) or calling your solar service provider. If you don't have a solar service provider, you can always reach our service department at 480-689-5050.
Sometimes, the old "turn on, turn off" fix can help your inverter reset and resolve issues. To turn off your system, follow this video from SolarEdge's Learning Lab.
Turn your SolarEdge inverter back on to complete its power cycle, and turn your AC disconnect back. You'll then want to reverse the steps in the video here. Check your system after about 5 minutes of the inverter powering up again. You should hear a faint clicking noise indicating your solar panels are producing power.
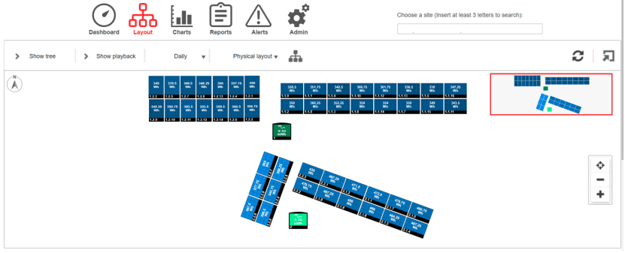
The SolarEdge app also lets you view real-time production by individual solar panels. At the top of your app, you'll want to hit the "Layout" button next to the "Dashboard" button. This will bring you to a layout schematic of your inverters, strings, modules, and their arrangement on your property.
Panels that produce the most energy will be in light blue, and panels that produce less energy will be in dark blue. This can be useful in troubleshooting issues as you can visually see what piece of the whole system isn't functioning properly.
There are two kinds of monitoring to choose from: active and self-monitoring. Sun Valley Solar Solutions performs active monitoring for a small annual fee. With this, we actively monitor your solar array's performance for you and let you know if anything isn't working as expected.
Self-monitoring allows the homeowner to check their system performance and alert our service team of any issues.
If you'd like more peace of mind that your inverter and system are working as expected, our in-house service department is ready to help. You can request a quote online here or call our service team at 480-689-5050.